Gold, silver and platinum: the week everything moved
Andorra Metals weekly analysis: China's gold buying, the Netherlands moving its gold, war in the Gulf, diesel, the Fed and bonds, and their possible effect on gold, silver and platinum.
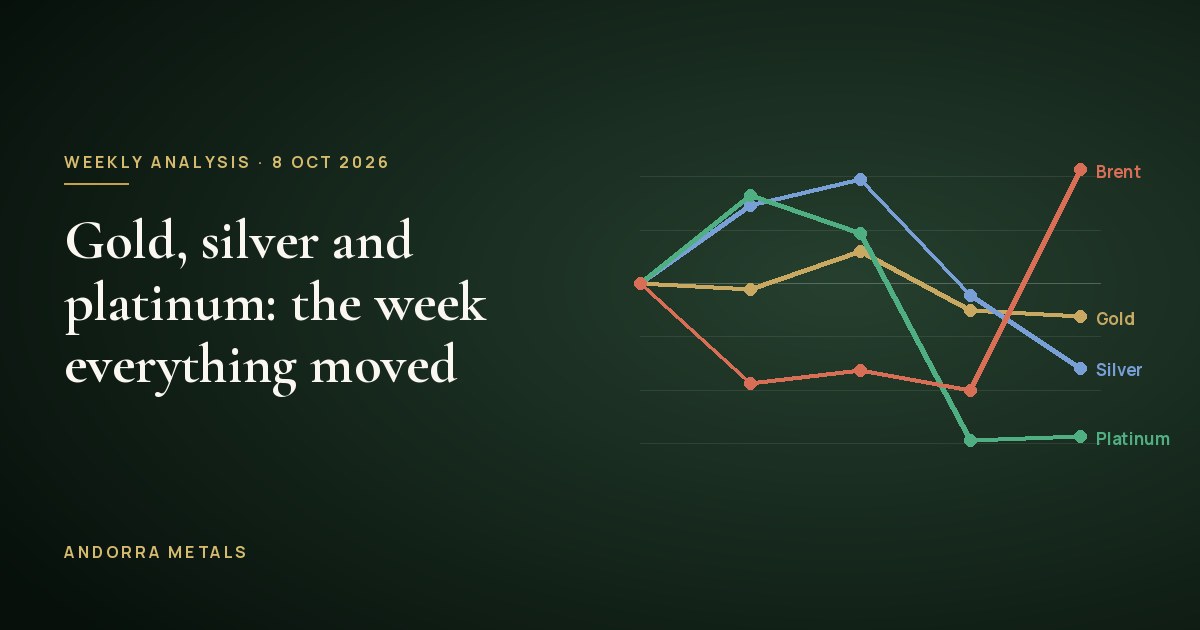
This week has left a paradox worth understanding: oil is rising sharply again while gold, silver and platinum remain close to their lows of the past two months. It is not a contradiction. It is how markets are digesting a war that makes energy more expensive and a Federal Reserve that is responding by raising rates.
To put the figures in context: gold hit its all-time high near $5,595 on 29 January and silver came close to $122 the same day. Today gold trades around 26% below that peak and silver at roughly half.
Central banks keep buying, and moving, their gold
The most important data point of the week for gold was not its price but who is buying it. The People's Bank of China announced on 7 October that it added some 740,000 ounces (around 23 tonnes) in September. It is its largest monthly purchase since 2023 and the 23rd consecutive month of accumulation. Its declared reserves now stand at around 77.5 million ounces, some 2,410 tonnes.
What matters is the pattern: China has stepped up its purchases precisely as the price has fallen. An official buyer with a horizon measured in decades does not chase rebounds; it takes advantage of corrections. Globally, central banks added a net 39 tonnes in August, led by China, Uzbekistan and Poland according to the World Gold Council.
The second move is quieter but just as revealing. The central bank of the Netherlands (DNB) has reorganised where it keeps its 612 tonnes of gold: it has moved a volume worth more than €10 billion out of New York and Ottawa. DNB says it wants to be "better prepared for severe crises". France already repatriated 129 tonnes from New York in January.
The underlying message: central banks do not just want more gold, they want it closer to home and under a jurisdiction they trust. It is the same logic any private investor should apply: where the metal is held and who certifies its ownership matter as much as the price at which it was bought. On the other hand, we have found no evidence that Gulf central banks are selling gold despite the blockade of their trade routes.
Geopolitics: greater risk of escalation, with diplomacy still alive
The conflict with Iran took a turn this week. According to The Atlantic, the White House has asked the Pentagon for strike options against Iran that could be carried out even before the 3 November midterm elections. At the same time, Vice President Vance has softened the nuclear demand, and Iran has said it will respond to the US proposal "in a few days", although it first demands the lifting of the naval blockade.
Oil is flowing through the Strait of Hormuz again, but not normally. Gulf exports excluding Iran have recovered their pre-war level, although only part of them crosses the strait and the rest is diverted through pipelines or transferred ship-to-ship at sea. War-risk insurance costs between 6% and 10% of hull value, and nine attacks on vessels have already been recorded in October.
The second flashpoint is Yemen. Saudi Arabia has launched an offensive to retake the Red Sea coast and the Bab el-Mandeb strait, and the Houthis are responding with almost daily missile fire on Riyadh: this week they attacked its international airport three times and forced diplomats into lockdown. Turkey and Pakistan have announced they are sending troops to Saudi Arabia. Iran, for its part, did not load a single barrel of crude in September because of the US blockade, according to Bloomberg.
Energy: crude adapts, diesel does not
The key to this crisis lies not so much in the barrel of crude as in what comes out of the refineries. Refined products crossing Hormuz remain far below their previous level, and Russian refineries are suffering constant Ukrainian attacks that have led Moscow to ban diesel exports until the end of October.
The result can be seen at the pump. Diesel has hit a record in the European Union, 43% more expensive than a year ago. In the United Kingdom it has topped £2 a litre for the first time, and in the US it costs about $6.30 a gallon, 71% more than a year ago.
Inventories offer little cushion. The International Energy Agency estimates that global stocks have fallen by around 507 million barrels since February, and its members have already released 325 of the 400 million barrels of strategic reserves committed in March. The G7 has added another 100 million, half of it diesel. These are temporary reliefs, not solutions.
Why does this matter for inflation? Because diesel moves lorries, ships, farm machinery and factories. Its rising cost feeds through, with a lag of a few months, into the price of food and almost all goods. The diagram below summarises the chain that, in our view, explains how metals are behaving:
The Fed, real rates and the bond market
The Federal Reserve raised rates in September, and the minutes published this week show that most of its members see another rise as appropriate before the end of the year. The market expects no change at the 27-28 October meeting but assigns around a 78% probability to a rise at the 8-9 December meeting.
This explains much of the recent weakness in metals. Gold and silver pay no interest, so when real rates (nominal rates minus expected inflation) rise, holding them carries a higher opportunity cost. Add to that a strong dollar.
What stands out is that the 10-year yield is rising even as the Fed tightens policy: investors are demanding more to lend long term to a heavily indebted state. Here lies the underlying tension. In the short term, high rates weigh on metals. But if energy inflation persists and the cost of debt becomes unsustainable, central banks may be forced to choose between tolerating more inflation or intervening in debt markets. In either case, real rates would tend to fall over time, and that has historically been the most favourable environment for gold.
What all this could mean for metals
We do not give price targets. What we can do is set out the forces that, in our view, are acting on metals over different horizons.
A tightening Fed, a strong dollar, rising yields and war headlines. High volatility: metals react more to rates than to geopolitics.
Expensive diesel, low inventories and central bank buying. Pressure from rates could ease if inflation forces a change of policy.
Public debt, reserve diversification and supply deficits: factors that have historically favoured precious metals.
An important caveat: a safe haven is not an asset without volatility. Gold has fallen more than 25% from its high in the middle of the conflict. Anyone considering exposure to precious metals should do so with a long horizon, a moderate share of their wealth and a clear idea of the costs of buying, selling and custody.
In summary
The week leaves three ideas. First: the war has spread from Hormuz to Yemen and the risk of escalation has increased, although diplomacy remains open. Second: the energy problem lies in diesel and refining, and that is feeding inflation that is more persistent than it seems. Third: in the short term interest rates call the shots for metals, but central banks are still accumulating gold and reorganising its custody, which says a lot about how they see the long term.
📄 Download this analysis as a PDF (in Spanish)
Sources
- CBS News – Iran, Hormuz and the Houthis
- BigGo Finance – People's Bank of China gold reserves · Kitco
- Al Jazeera – the Dutch gold transfer · MINING.COM
- TBS News – the cost of crossing Hormuz · ShipUniverse
- Euronews – record EU diesel prices · fuel-prices.eu · AAA
- Trading Economics – 10-year bond and the Fed
- Investing.com – historical prices for gold, silver, platinum and Brent